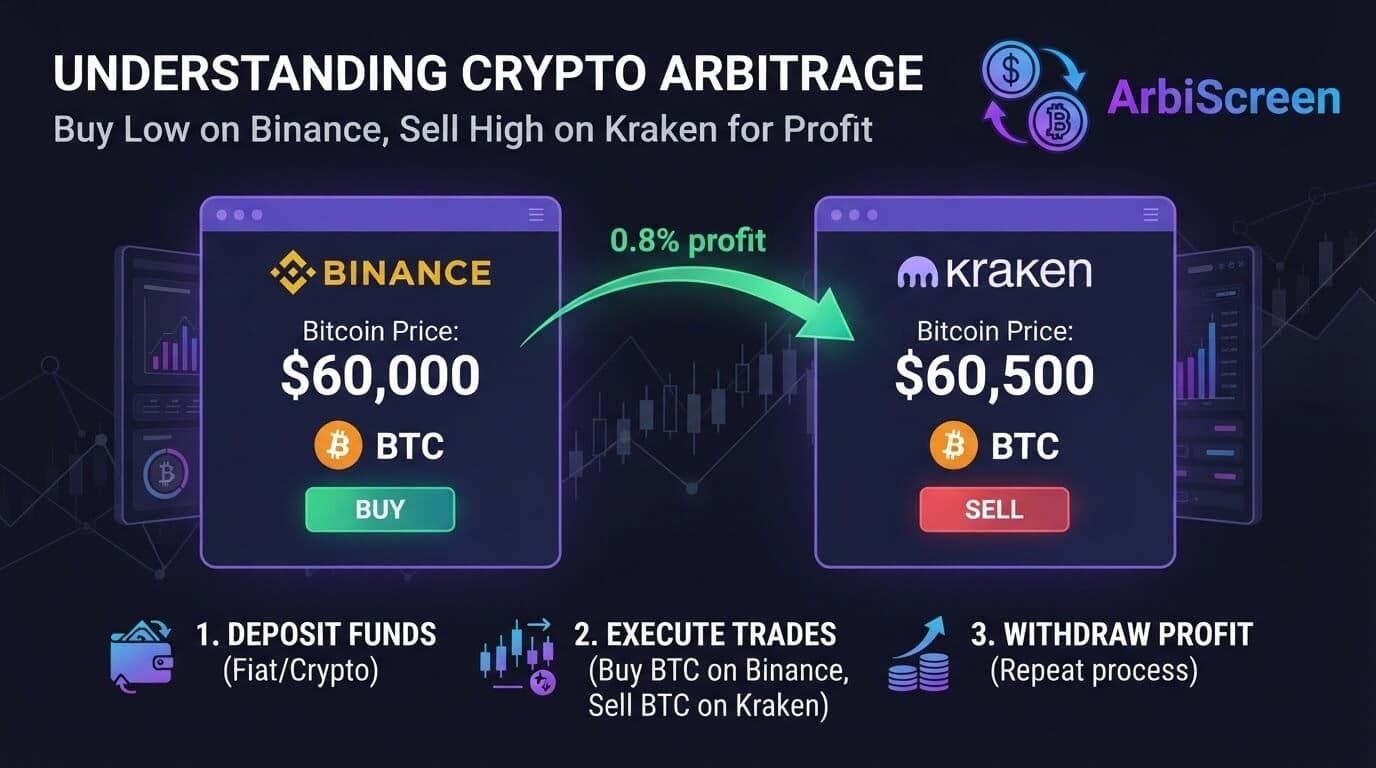
The honest answer: yes, crypto arbitrage is profitable — but not in the "get rich overnight" way YouTube gurus promise. Profit is real, repeatable, and boring. It lives in the gap between the spread you see and the fees you don't. This page is all numbers: what you actually keep after every cost, at every capital level, so you can decide if it's worth your time before you deposit a single dollar.
Arbitrage profit reduces to one formula. Everything else is detail:
A "spread" is the price difference for the same coin between two exchanges. If BTC trades at $67,000 on Exchange A and $67,340 on Exchange B, the raw spread is 0.51%. But you never keep the full spread — you keep what's left after buying, selling, and moving funds. Here's the same 0.51% spread at three capital levels:
Notice what happens: fixed fees (withdrawals, network gas) don't scale with capital, so the same trade that barely breaks even at $100 nets $46.50 at $10,000. This is the single most important thing to understand about arbitrage profitability — your percentage of fixed cost shrinks as your capital grows.
Most beginners look at a 0.8% spread and mentally spend the whole thing. Reality subtracts four layers before you see a cent:
Rule of thumb: assume 0.3–0.6% total round-trip cost. If the spread isn't at least double your expected fees, skip it — the risk isn't worth the margin.
These figures assume disciplined trading on genuine opportunities only — not chasing every flicker. Average net spread captured of ~0.4%, roughly 22 trading days a month:
These are optimistic-but-achievable targets for an attentive trader with the right tooling, not guarantees. ROI dips at $10K because opportunities large enough to absorb the capital are rarer — a real constraint most "calculators" ignore.
Sharp moves desync exchange prices. Spreads widen from 0.2% to 1–3%.
ETF decisions, Fed announcements, exchange listings — order books lag reality.
A coin listing on a new exchange often trades at a premium for hours.
When one venue halts withdrawals, its price decouples — large, temporary spreads.
The "Kimchi premium" and similar effects create persistent geographic gaps.
Honesty means telling you when to sit on your hands. Skip trading when:
Every problem above — hidden fees, dying spreads, expensive withdrawal networks — is exactly what ArbiScreen was built to solve. Most scanners show you a gross spread and let you discover the fees the hard way. ArbiScreen does the opposite:
The real power isn't a single month — it's reinvesting. Start with $500 at a conservative 5% monthly net return, rolling profits back in:
Six months turns $500 into ~$670 — a 34% total gain without adding a dollar. Extend to 12 months and it's ~$898. Compounding is slow, then sudden; the traders who win are the ones who don't withdraw early.
Not all arbitrage carries the same fee profile, and this directly changes profitability. There are two dominant approaches:
The takeaway for profitability: pre-funding your accounts can turn a 0.45% fee load into a 0.2% one, roughly doubling your net on the same spread. It requires more upfront capital spread across venues, but it's the single biggest lever an intermediate trader can pull.
Arbitrage's edge isn't the highest ceiling — day trading can beat it in a good month. Its edge is consistency and win rate. You're not betting on direction; you're collecting a mechanical gap. That's why it's one of the few strategies where "boring" is a compliment.
Trades between classes, 1–2 opportunities a day on cheap networks (TRC20 only). Nets ~$8–$12/month. It won't pay rent, but it's real money learned on a live account — and the habits scale.
Checks ArbiScreen alerts 3–4 times a day around a full-time job. Nets ~$120–$160/month, reinvested. After a year of compounding, the account is meaningfully larger with near-zero drawdown.
Treats it as a job: pre-funded accounts on 5+ exchanges, executes only 6%+ net-fee-adjusted spreads. Nets $600–$900/month consistently. The bottleneck isn't skill — it's finding opportunities big enough to deploy the capital.
Because withdrawal and network fees are fixed, there's a minimum trade size below which arbitrage simply can't profit. If your round-trip fixed fees are ~$3 and your net spread is 0.4%, you need:
This is why sub-$100 arbitrage feels rigged — it is, by the math. Either use the cheapest networks (dropping fixed fees to ~$1, cutting break-even to $250), or wait for wider spreads. ArbiScreen's net-profit filter hides everything below your personal break-even automatically, so you never waste a trade.
Wondering about the rules too? See our country-by-country guide to whether crypto arbitrage is legal.
Yes. Fragmented liquidity across hundreds of exchanges guarantees price gaps. The edge is smaller than in 2017, but net-profit tooling more than makes up for it.
You can start with $100 to learn, but ~$500–$1,000 is where net profit becomes meaningful after fixed fees.
Because trading fees, withdrawal fees, network gas, and slippage all subtract from the gross spread. Always trade on net, not gross.
Withdrawal network fees. Choosing ERC20 over TRC20 when it isn't necessary can quietly cost $10–$25 per transfer.
Partially. Scanning and alerts are automatable; execution across exchanges still benefits from human judgment on spread age and liquidity.
Lower than directional trading, but not zero. The main risks are execution timing (spread closing mid-trade) and transfer delays, not market direction.
It shows net profit after all fees, compares withdrawal networks, and flags spread age — the three things that decide whether a trade actually pays.
ArbiScreen shows real, after-fee opportunities in real time — free to start.
Launch ArbiScreen →