A crypto pump and dump detector is a tool that identifies coordinated market manipulation on cryptocurrency tokens. Pump and dump schemes are the most common form of fraud in crypto markets — insiders quietly accumulate a low-cap token, artificially inflate its price, and then sell their holdings into retail demand, leaving late buyers with massive losses.
Traditional pump and dump detection relies on lagging indicators like price spikes or social media hype. By the time these signals appear, the manipulation is already underway. The ArbiScreen Pump and Dump Detector takes a different approach — it monitors wallet-level behavior to identify pump and dump setups before the price moves, giving traders the ability to distinguish between genuine organic growth and orchestrated pump and dump manipulation.
Our pump and dump detection system continuously scans 111 BSC tokens, tracking on-chain wallet movements, exchange inflows, open interest dynamics, and funding rate anomalies. Each token is classified into a manipulation lifecycle phase — accumulation, markup, distribution, or dead — providing a complete picture of where the pump and dump cycle stands at any moment.
The ArbiScreen Pump & Dump Detector is a proprietary on-chain intelligence tool that monitors 111 BSC tokens listed on Binance Futures but absent from Binance Spot. Our algorithm tracks whale wallet movements, detects accumulation patterns, and classifies each token into a manipulation lifecycle phase — so you can see the setup before the price explodes.
Not every crypto token gets pumped and dumped. Manipulators specifically target tokens that sit in a unique market position: listed on Binance Futures with leverage up to 20×, but without a deep Binance Spot order book. This creates the perfect storm:
Our algorithm continuously scans all tokens fitting this profile — currently 111 across the BSC network — and maps every wallet movement, every exchange deposit, every unusual concentration pattern.
The ArbiScreen Pump & Dump Detector uses a multi-layer proprietary scoring model that combines on-chain wallet analysis with derivatives market data. Here is what the system tracks for each token:
| Layer | What It Analyzes |
|---|---|
| Whale Wallet Intelligence | Top holder concentration, insider accumulation patterns, farmer network detection (coordinated wallets disguised as independent holders) |
| Exchange Flow Tracking | Token movements into centralized exchanges — when insiders start depositing to sell, our system flags it before the dump begins |
| Phase Classification | Automated lifecycle stage: 🟢 Accumulation → 🔵 Markup → 🟠 Distribution → ⚫ Dead — based on 15+ quantitative factors |
| Trading Signals | 🟢 ENTRY / 🔥 IGNITION / 🚨 EXIT — scored by a 5-factor model that weighs drawdown depth, momentum, leverage positioning, and distribution activity |
| Wash Trading Score | Detects fake volume through circular on-chain transfers and exchange-to-exchange token recycling |
Why wallet-level tracking matters: Price and volume data alone are lagging indicators — by the time the chart shows a spike, the pump is already underway. Our algorithm watches what insiders DO with their tokens (accumulate, hold, transfer to exchanges) — these are leading indicators that appear days to weeks before price movement.
Every token tracked by our detector has a story. Here are three that illustrate the classic pattern — and how our system would have flagged them.
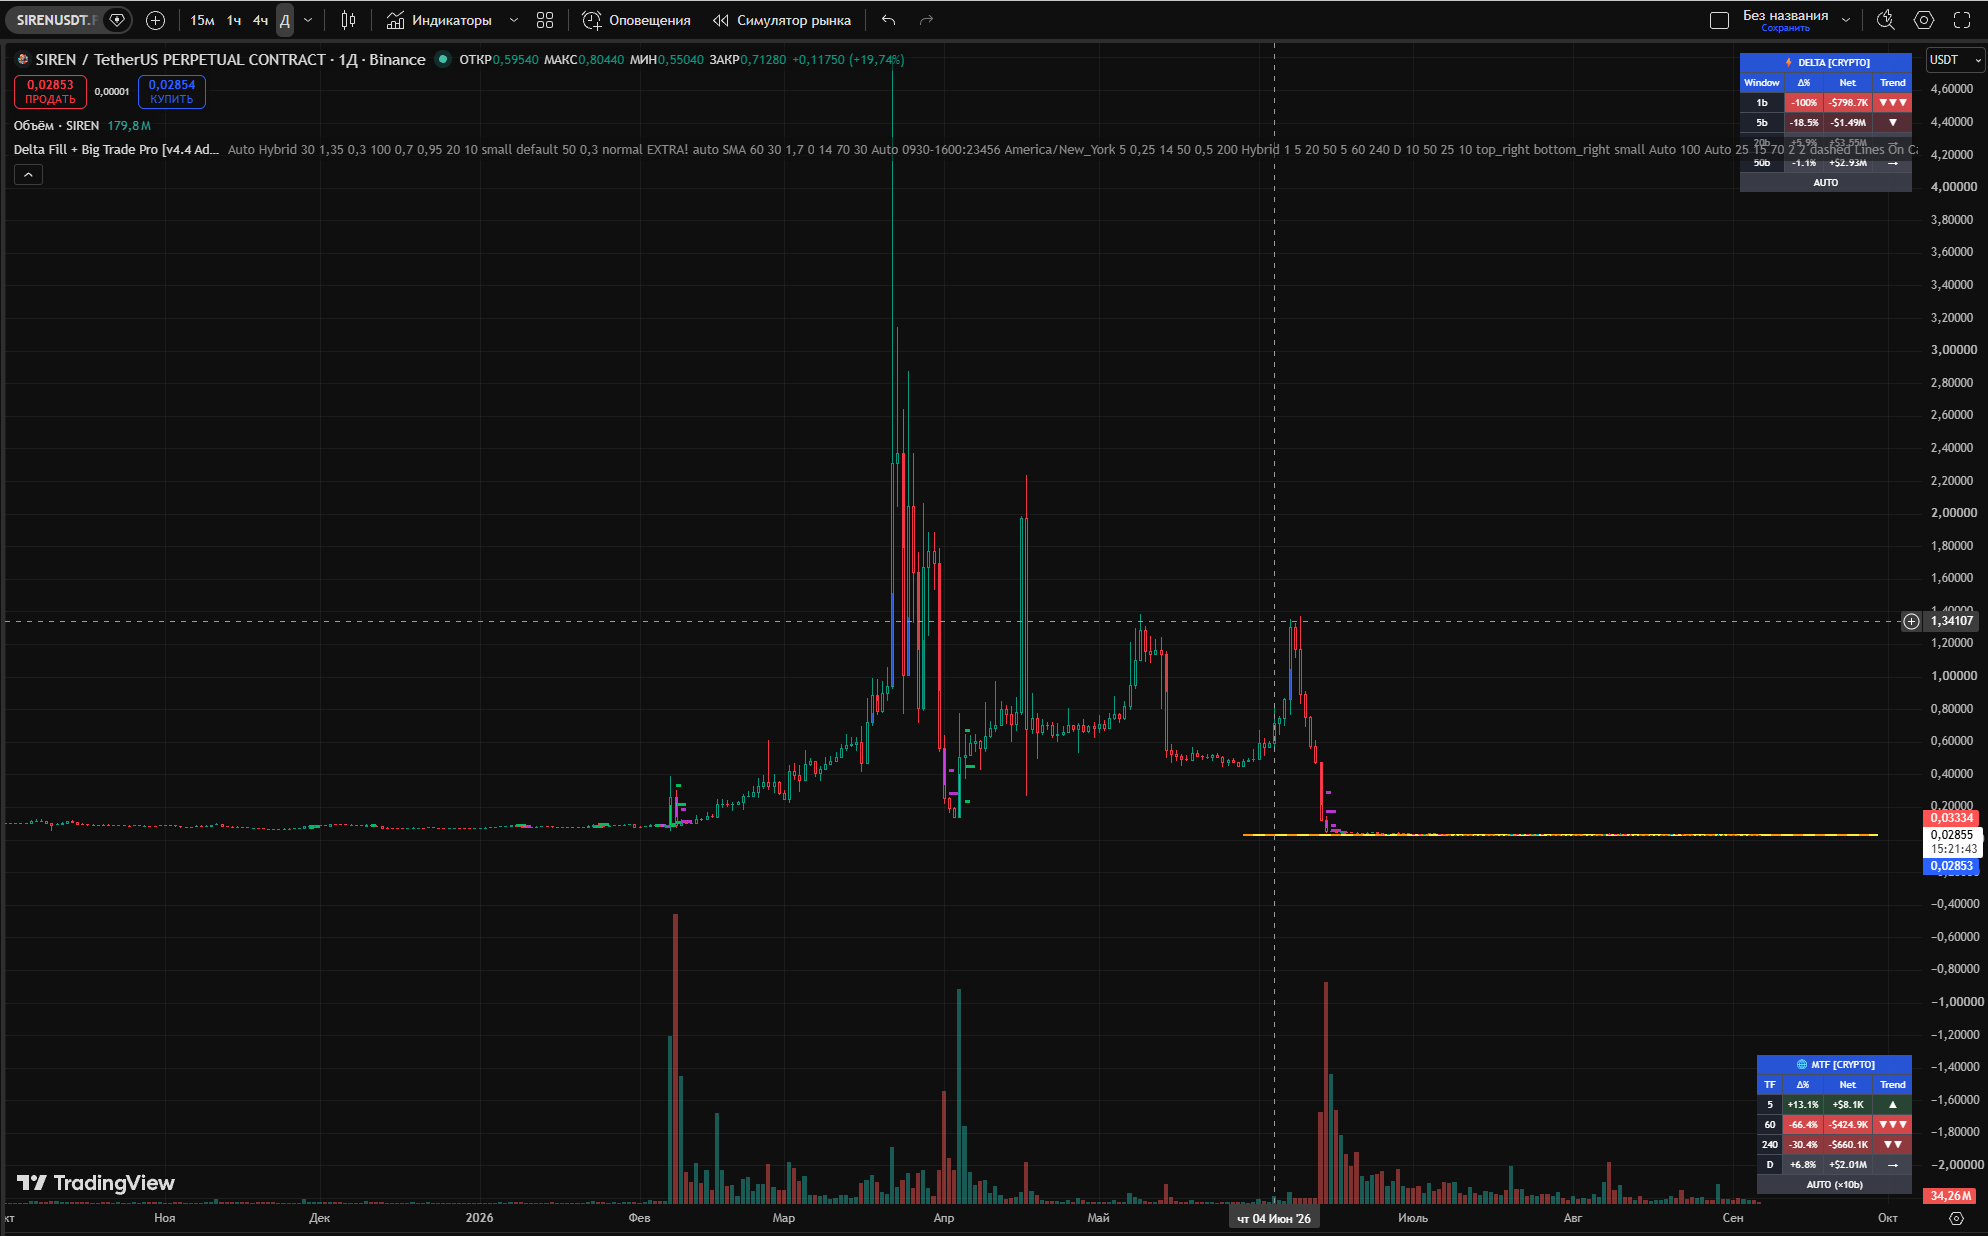
SIREN launched on BSC with a Binance Futures perpetual but no Binance Spot listing. During the accumulation phase, a small group of wallets quietly built positions on DEX while the token traded sideways under $0.50. Then came the markup — SIREN ripped to its all-time high of $4.81 as leveraged longs piled in on futures.
The distribution was textbook: insider wallets began transferring tokens to exchange deposit addresses. CEX-held percentage jumped from under 5% to over 40% in a matter of days. Our algorithm would have flagged the 🚨 EXIT signal as soon as exchange inflows spiked — while the price was still near the top.
Today: SIREN trades at $0.028 — a 99.4% drawdown. Phase: ⚫ Dead. The cycle is complete.
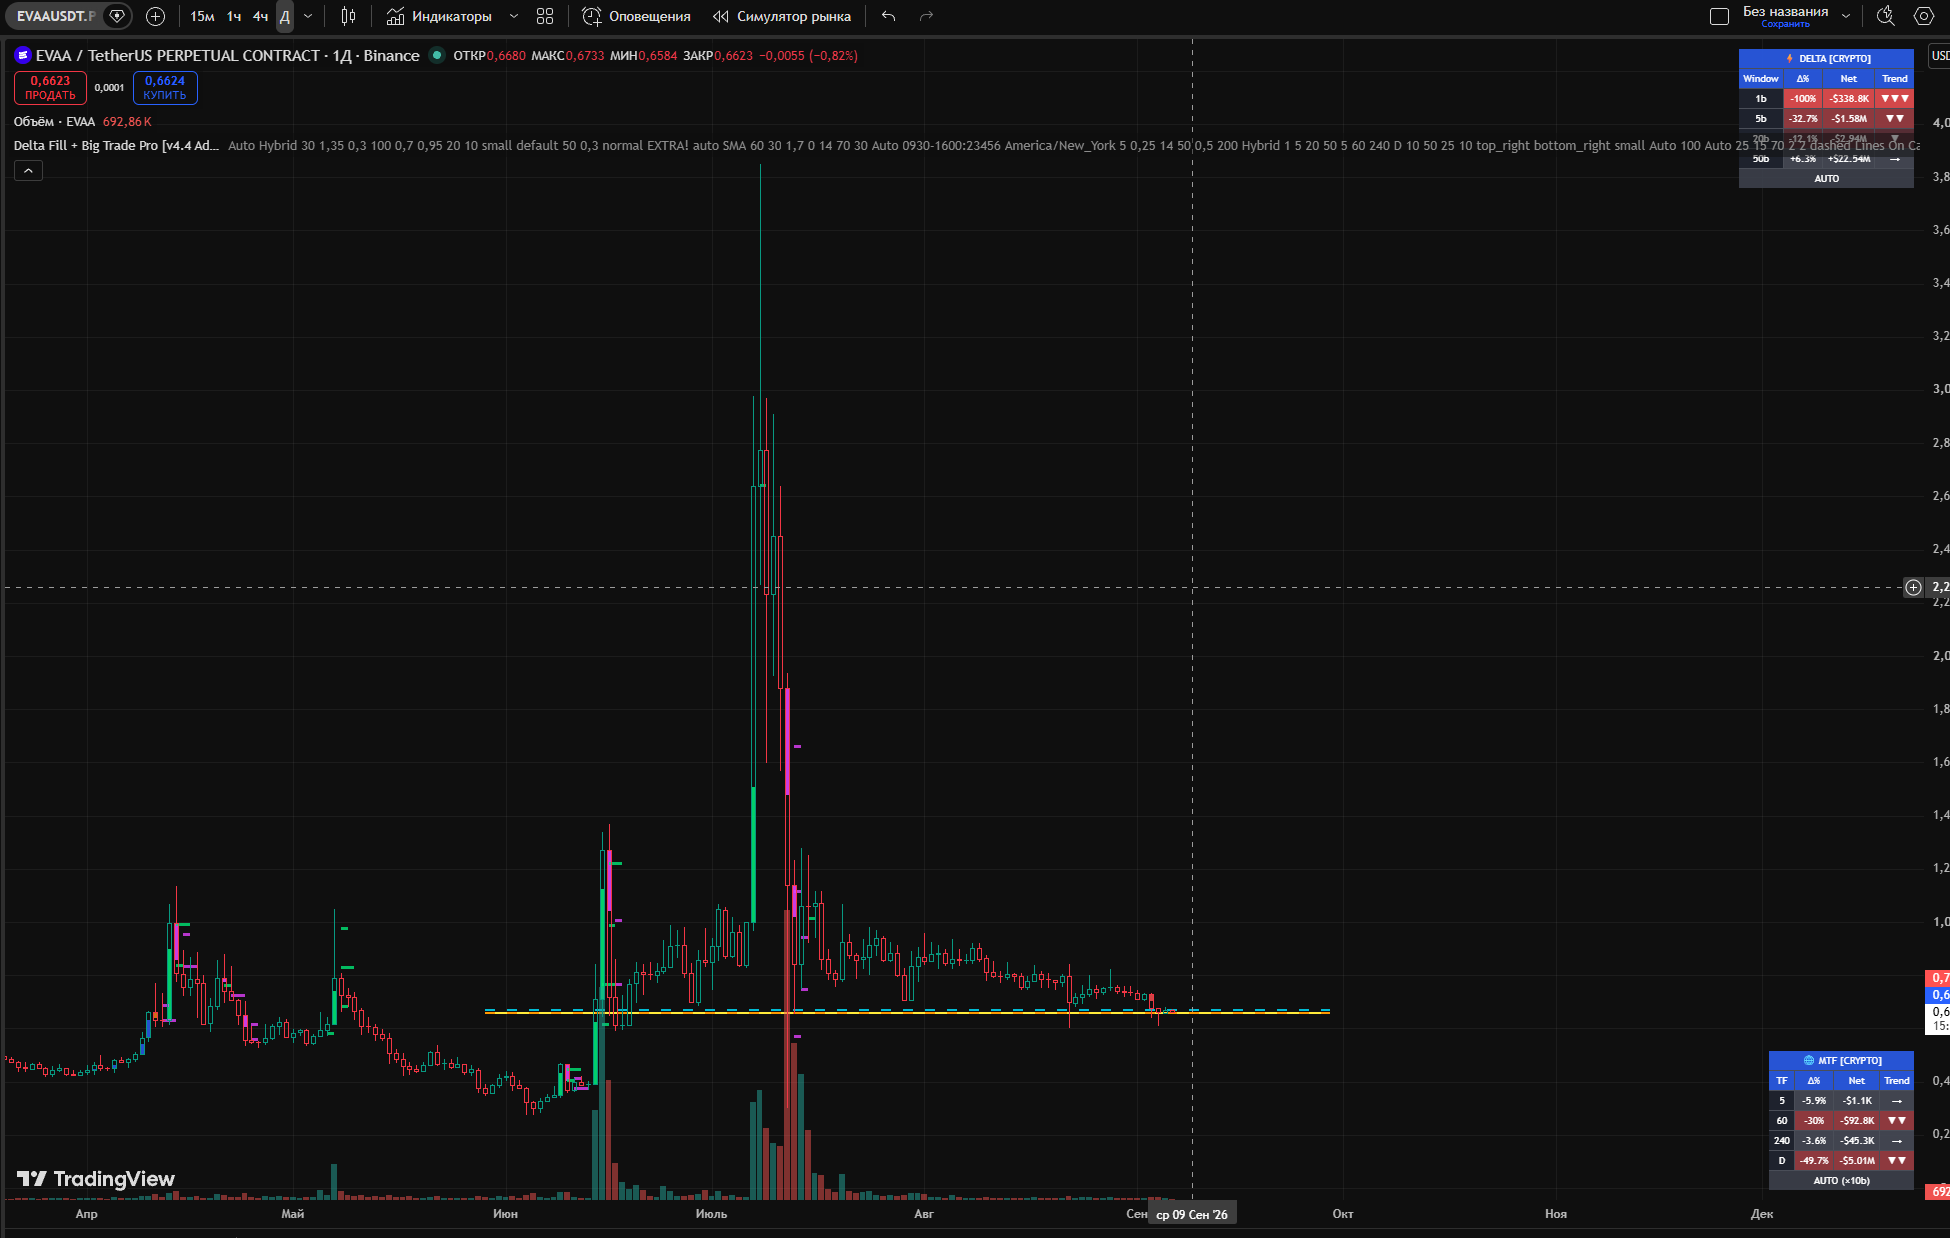
EVAA was one of the most explosive markup events we tracked. During its pump phase, the token showed +348% in 30 days with open interest surging +286% — classic signs of a leverage-driven markup with retail piling into futures positions.
The turning point came when the 24-hour candle dropped −22% while the 30-day was still +30%. Our "broken pump" detection rule caught this divergence and automatically flipped the phase from Markup to Distribution, and the signal from ENTRY to EXIT.
Today: EVAA sits at $0.67 — down 95% from its peak. The entire cycle from accumulation to dead took approximately 8 weeks.
MYX is one of the deepest drawdown cases in our universe. It peaked at $18.65 — a level driven entirely by thin-liquidity spot manipulation combined with leveraged futures cascades. The token had all the hallmarks: concentrated whale holdings, minimal organic trading activity, and a rapid markup phase that lasted less than two weeks.
When distribution began, whale wallets moved tokens to exchange addresses in coordinated batches — a farmer network pattern our algorithm detects by analyzing transfer timing and intermediary wallet connections.
Today: MYX trades at $0.072 — a 99.6% collapse. Liquidity has dried up to $253K. Phase: ⚫ Dead.
ArbiScreen Tools
Don't Be Exit Liquidity
The ArbiScreen Pump-Dump Detector scans 111 BSC tokens in real time — see which ones are in accumulation, which are pumping, and which are about to dump.
Open Pump-Dump Scanner →Every token in our scanner is automatically assigned one of four lifecycle phases based on our proprietary scoring model:
Price is beaten down — typically 50-95% from ATH. Whale wallets are quietly adding to positions. Exchange holdings are low (tokens are on-chain, not ready for selling). Open interest may be building, but the price action is flat. This is where opportunities are born — and where most traders are not looking.
The price starts moving. 7-day and 30-day returns turn positive. Leveraged traders pile in, creating liquidation cascades that amplify the move. Volume spikes. Social media picks up the token. Everything looks bullish — which is exactly when distribution begins behind the scenes.
The operators are cashing out. Our algorithm detects this through rising exchange inflows — tokens flowing from whale wallets to CEX deposit addresses. The price may still be elevated, but the smart money is exiting. Funding rates reach extreme levels as retail is still buying the top.
The cycle is over. Price has crashed 80-95% from peak. Open interest has collapsed. Volume is negligible. The token exists on futures but the manipulation cycle is complete. Out of our 111 tracked tokens, 32 are currently in dead phase — a graveyard of completed pump-and-dump cycles.
Beyond phase classification, our algorithm generates actionable trading signals based on a proprietary 5-factor scoring model:
| Signal | What It Means |
|---|---|
| 🟢 ENTRY signal | Token is in accumulation or early markup with favorable conditions — deep drawdown, rising momentum, positioning building, no distribution activity detected. Currently 15+ tokens carry this signal. |
| 🔥 IGNITION signal | First day of breakout from a flat base — the earliest possible signal. Fires when a 24h spike of 12%+ emerges from a dormant base with no selling pressure. The highest-conviction, highest-risk signal. |
| 🚨 EXIT signal | Distribution detected — exchange inflows surging, funding rate at extremes near ATH, or phase flipping to distribution. Get out. |
| ⚪ WATCH signal | Some positive factors but not enough for a full signal. On the radar, not actionable yet. |
| ⛔ AVOID signal | Phase = dead. The cycle is complete. No opportunity remains. |
Risk disclaimer: Trading pump-and-dump tokens is inherently high-risk. Even with the detector, timing exits perfectly is extremely difficult. Prices can crash 50%+ in hours. Never invest more than you can afford to lose entirely. These signals are analytical tools, not financial advice.
Most "pump detectors" in crypto simply watch for volume spikes or social media mentions. By the time those indicators fire, the pump is already halfway done — and you are buying someone else's exit liquidity.
ArbiScreen takes a fundamentally different approach:
ArbiScreen Tools
Open the Scanner — It's Free
Register on ArbiScreen and start monitoring 111 tokens. Phase classification and basic signals are free for all users.
Open Pump-Dump Scanner →Real TradingView charts of tokens tracked by our Pump-Dump Screener. Each one followed the classic manipulation lifecycle — accumulation, markup, distribution, and collapse. These are the patterns our detection system is built to catch.
Textbook Wyckoff distribution on a BSC futures-only token. Quiet accumulation below $0.50 → explosive markup to ATH $4.81 → insider wallets began moving tokens to exchange deposit addresses. Our EXIT signal would have fired as CEX-held percentage spiked above 40%. Today: flatlined near zero.
One of the most explosive markup events we tracked. +348% in 30 days with OI surging +286% — classic leverage-driven pump with retail piling into futures. The “broken pump” detection rule caught the 24h/30d divergence and flipped the phase from Markup to Distribution, signal from ENTRY to EXIT. Total cycle from accumulation to dead: ~8 weeks.
The deepest drawdown in our universe. Price peaked at $18.65 — driven entirely by thin-liquidity spot manipulation with futures amplification. Once the markup phase broke, the token bled through every support level. Delta Fill shows the asymmetry: massive sell-side pressure with zero buy-side recovery. Now flat near $0.07.
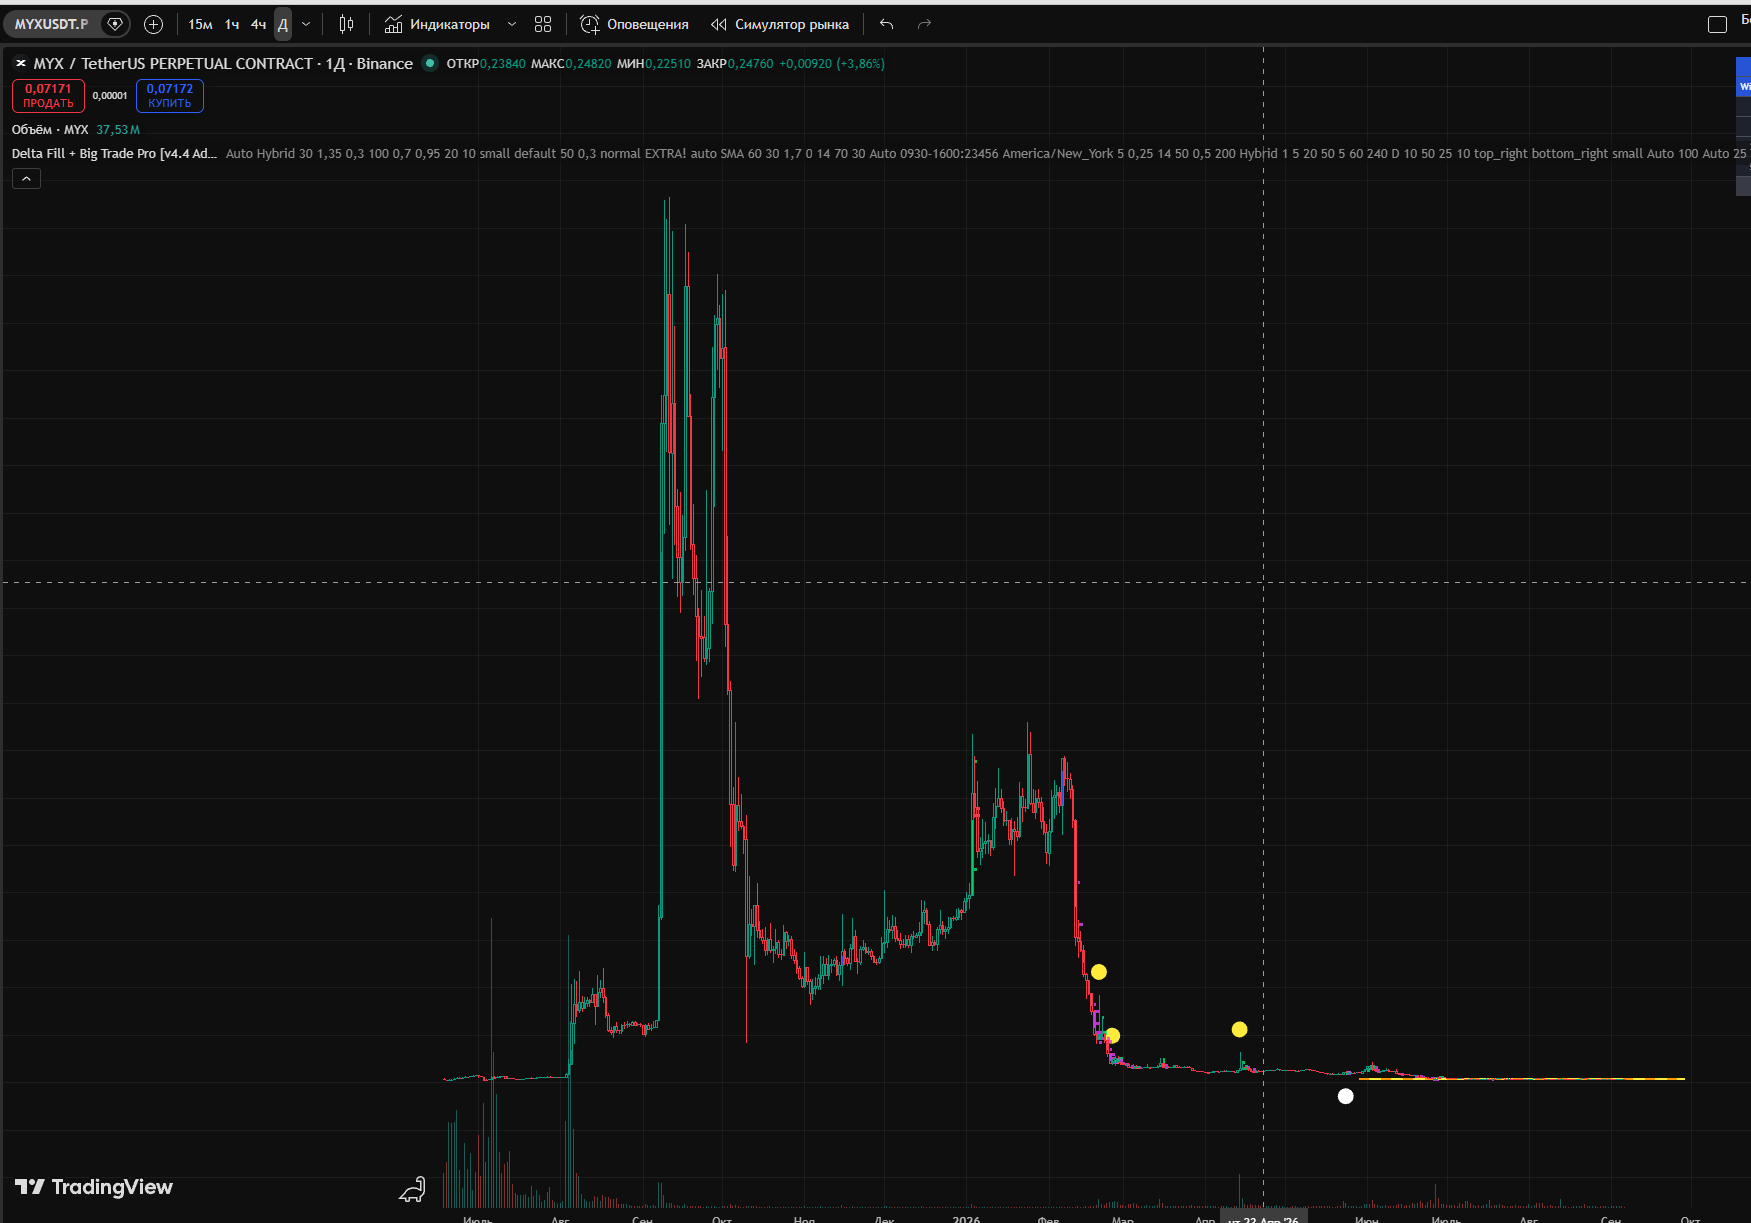
⚠️ Educational disclaimer: These charts show historical price action of tokens tracked by our detection system. They are provided for educational purposes only to illustrate how pump-and-dump schemes play out on-chain. Past patterns do not guarantee future detection accuracy. ArbiScreen provides analytical signals, not financial advice. Always DYOR.