Every crypto trader who chases price gaps between exchanges eventually asks the same question: how much will I actually keep after fees? An arbitrage calculator answers that question before you commit capital — turning a promising spread into a concrete dollar figure or a clear "not worth it." Without one, you are guessing, and in a market where a 0.3 % fee swing can erase an entire spread, guessing is expensive. The math behind arbitrage is not complicated, but it has more layers than most beginners expect. Buy price, sell price, and the difference between them is just the surface. Underneath sit withdrawal fees, network gas costs, exchange-specific trading fees, slippage on thin order books, and the time cost of moving funds between venues. A good calculator forces you to account for every layer. A great one updates in real time so you know whether an opportunity still exists by the time your transfer lands. This guide walks through every type of arbitrage calculation you will encounter in 2026 — spot cross-exchange, funding rate arbitrage, and triangular rotation — then compares the tools available, explains how ArbiScreen's spread scanner bakes fees directly into its live data, and finishes with a practical FAQ covering the edge cases that trip up even experienced traders. ---
Spotting a price difference is the easy part. Bitcoin might show $63,400 on Binance and $63,580 on Kraken — a $180 gap on a single coin. Exciting. But before you move, the calculator shows whether that gap survives the round trip.
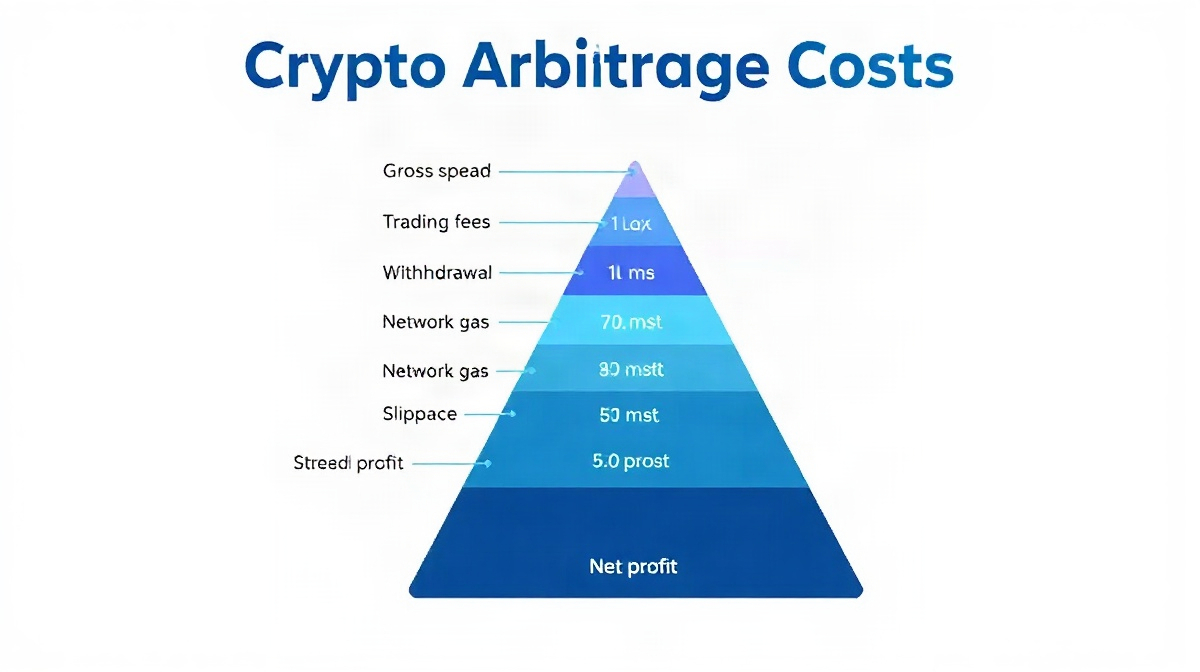
Consider the real cost stack on a $10,000 trade:
Total cost: $43–$59. Your gross spread was $180, so net profit is roughly $121–$137 — a 1.2–1.4 % return. That is worthwhile. But if fees were higher or the spread narrower, the calculator would have shown a negative number before you deployed any capital.
The value of running the math first is not just avoiding bad trades. It is also helping traders rank opportunities by actual yield, set minimum spread thresholds on a scanner, and build a risk-adjusted picture of a strategy over time.
---
Every type of arbitrage starts with the same core equation:
Net Profit = (Sell Price − Buy Price) × Amount − Total Fees
Where Total Fees = Buy-Side Fees + Sell-Side Fees + Transfer Fees + Slippage Estimate
Let's build that out with a concrete example. You buy 1 ETH at $3,200 on Exchange A and sell at $3,250 on Exchange B.
ROI % = (Net Profit / (Buy Price × Amount)) × 100 = (38.55 / 3200) × 100 = 1.20 %
That 1.20 % on a single round trip, executed multiple times per day with sufficient capital, compounds into meaningful returns. But notice how $11.45 — nearly 23 % of the gross spread — evaporated in fees. The formula makes that visible. Every arbitrage trade lives or dies by this math, and running the numbers before execution is what separates disciplined traders from gamblers.
---
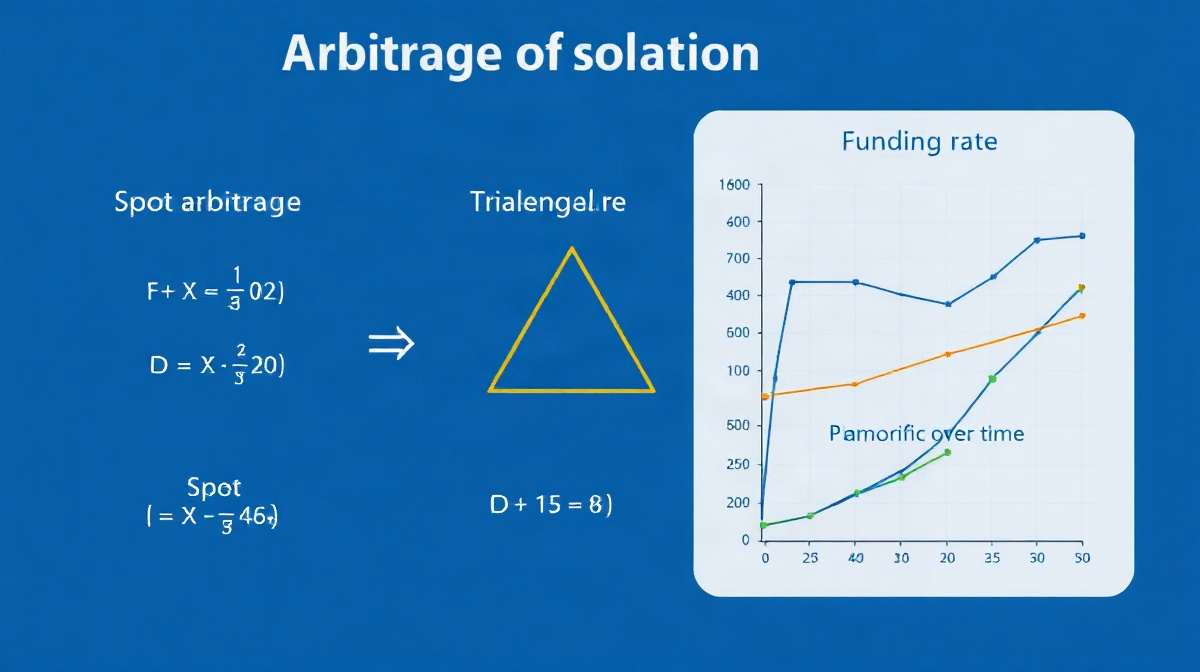
Spot arbitrage is the most straightforward form: buy a token on one exchange, transfer it, and sell on another exchange where the price is higher.
Gross Profit = (Sell Price − Buy Price) × Amount
Buy-Side Fee = Buy Price × Amount × Buy Fee Rate
Sell-Side Fee = Sell Price × Amount × Sell Fee Rate
Net Profit = Gross Profit − Buy-Side Fee − Sell-Side Fee − Withdrawal Fee − Slippage
Annualized ROI % = (Net Profit / Capital Deployed) × (365 / Days to Complete Trade) × 100
For a transfer that takes 30 minutes, "Days to Complete Trade" = 0.021. If your net profit on $10,000 is $38, annualized that becomes: (38 / 10,000) × (365 / 0.021) × 100 ≈ 661 % APR — but only if you can repeat the trade continuously, which requires pre-positioned capital on both exchanges.
---
Funding rate arbitrage is the most popular delta-neutral strategy in crypto right now. The idea: go long spot, short the same asset in perpetual futures, collect the funding payment when the rate is positive (longs pay shorts). Your net price exposure is zero; your income is the rate.
Funding Rate APR = Funding Rate (8h) × 3 × 365 × 100
If BTC perpetual funding is 0.03 % every 8 hours:
APR = 0.03 % × 3 × 365 = 32.85 % APR
That is the gross rate arbitrage return. Now subtract costs:
Net Funding APR Formula:
Net APR = Funding Rate APR − (Total Trading Fees / Days to Hold × 365) − Borrow Rate APR
For a $10,000 position held 30 days at 32.85 % gross APR:
The apr calculator portion is critical because funding rates are not fixed — they fluctuate every 8 hours. A position that opens at 0.05 % funding might drop to 0.01 % within a week, cutting income by 80 %. Real-time monitoring of the rate is essential.
For the short futures leg, you need to monitor the liquidation price. The formula depends on leverage:
Liquidation Price (Short) = Entry Price × (1 + 1/Leverage − Maintenance Margin Rate)
At 2x leverage with 0.5 % maintenance margin on a $50,000 BTC short:
Liquidation Price = $50,000 × (1 + 0.5 − 0.005) = $75,250
You are safe until BTC rises 50.5 % above entry. If you use 5x leverage, that buffer shrinks to ~19 %, and sudden price spikes can force costly position closures that turn a profit strategy into a loss.
---
Triangular arbitrage exploits pricing inconsistencies within a single exchange across three currency pairs. Instead of moving funds between platforms, you rotate through a cycle: Asset A → Asset B → Asset C → Asset A.
Start with $1,000 USDT. Trade path: USDT → BTC → ETH → USDT
Step 1: USDT → BTC at rate 0.0000157 BTC/USDT → receive 0.0157 BTC
Step 2: BTC → ETH at rate 19.8 ETH/BTC → receive 0.31086 ETH
Step 3: ETH → USDT at rate $3,230/ETH → receive $1,004.08 USDT
Gross profit: $4.08 on $1,000 = 0.408 %
Subtract three taker trading fees at 0.1 % each: 0.3 % total = $3.00
Net profit: $1.08 on $1,000 in a single rotation
End Amount = Start Amount × Rate1 × Rate2 × Rate3 × (1 − Fee)^3
Profit = End Amount − Start Amount
Condition for profitability: Rate1 × Rate2 × Rate3 > 1 / (1 − Fee)^3
For 0.1 % fees: (1 − 0.001)^3 = 0.997. So the product of the three rates must exceed 1.003 to be profitable.
---
A basic calculator handles trading fees. A complete one handles everything below.
Withdrawal fees vary by network, not just by exchange. Sending USDT via TRC-20 costs ~$1. Sending via ERC-20 costs $5–$40 during congestion. Always check the actual network fee before calculating expected profit.
Slippage is the difference between the quoted price and the actual fill price when you execute at market. On a $50,000 buy, even 0.15 % slippage costs $75 — more than some spreads are worth. Always check order book depth before calculating with the quoted price.
Deposit processing time matters for spot arbitrage. A 30-minute blockchain confirmation means the price on the destination exchange might have moved against you. This is why pre-positioning capital across multiple exchanges is standard practice among professionals.
Opportunity cost is the rate your capital could earn elsewhere while it sits in transit. If your capital earns 5 % APR in a money market fund, every dollar locked in a flat arbitrage position costs you 5 % annually in forgone yield.
Tax drag applies in many jurisdictions. Frequent short-term trades may be taxed as ordinary income. A 30 % tax on a 2 % gain leaves you with 1.4 % effective return. High-frequency spot arbitrage can generate hundreds of taxable events per day.
Risk of exchange failure is not a calculation input but is a real cost. Holding large balances on multiple exchanges to execute arbitrage concentrates counterparty exposure. The implicit cost is the risk premium you accept.
---
ArbiScreen's spread scanner stands out because it pulls live order book data, applies actual exchange fee tiers, and presents the net spread after costs — not the gross price gap. Most free tools show you the gross opportunity; ArbiScreen shows you whether it is real.
---
ArbiScreen is built around one core principle: the number you see is the number you keep, not the number you chase.
When ArbiScreen's scanner detects a price difference between two exchanges, it does not simply display the raw gap. It runs a full cost calculation in the background:
The result is a net spread percentage. If ArbiScreen shows 0.8 %, that is after fees. A calculator that shows raw price differences might show 1.4 % on the same pair — and after fees, that arbitrage trade loses money.
For funding rate arbitrage, ArbiScreen tracks the rate arbitrage across major perpetuals markets, displays the 8-hour rate, annualizes it automatically using the apr calculator formula, and flags when the rate crosses user-defined thresholds. Traders set alerts when a funding rate APR exceeds a target — making real-time monitoring genuinely practical.
The deposit and withdrawal information per exchange is also surfaced, so you know before executing whether the transfer corridor is open, what minimum deposit applies, and which network is fastest and cheapest for that specific token.
---
If you want full control over fee structures and custom logic, a Python-based calculator takes about 50 lines of core code. Here is the conceptual structure covering the key variables:
Core input variables:
buy_price — current ask price on exchange Asell_price — current bid price on exchange Bamount — quantity to trade (in base asset)buy_fee_rate — e.g. 0.001 for 0.1% taker feesell_fee_rate — e.g. 0.001 for 0.1% taker feewithdrawal_fee — flat fee in USD equivalentslippage_est — estimated slippage in USDCore calculation logic:
gross_profit = (sell_price - buy_price) * amountbuy_fee = buy_price amount buy_fee_ratesell_fee = sell_price amount sell_fee_ratetotal_fees = buy_fee + sell_fee + withdrawal_fee + slippage_estnet_profit = gross_profit - total_feesroi_pct = (net_profit / (buy_price amount)) 100To extend this to funding rate arbitrage:
funding_rate_8h — e.g. 0.0003 for 0.03%hold_days — how many days to hold the positionperiods = hold_days * 3 — three 8h periods per dayfunding_income = position_size funding_rate_8h periodsnet_funding = funding_income - total_feesapr = (net_funding / position_size) (365 / hold_days) 100The formula logic is straightforward. The challenge is keeping fee data current — exchanges change their fee schedules, networks change gas costs, and funding rates change every 8 hours. A static calculator goes stale fast. This is why live tools like ArbiScreen offer a practical advantage over spreadsheets for active traders.
---
Using last-trade price instead of ask/bid. The last trade might have happened seconds ago at a price that no longer exists. Always use the current ask when buying and the current bid when selling.
Ignoring fee tiers. Most exchanges offer lower trading fees at higher 30-day volume. If you are a high-volume trader using retail fee rates in your calculator, every calculation overstates your cost.
Forgetting the round trip. Some traders calculate only the entry fees and forget that selling also incurs a fee. The formula must include both legs of every trade.
Assuming instant transfers. Spot arbitrage across exchanges requires moving tokens. During that time, the arbitrage opportunity can close. Treat transfer time as a risk variable.
Ignoring minimum trade sizes. Some exchanges have minimum order values of $10 or $25. Small amount examples may not be executable, which breaks the math entirely.
Not accounting for funding rate decay. Funding rates mean-revert. A 0.1 % 8-hour rate that looks like 109 % APR rarely persists. Projecting current rates forward indefinitely produces wildly optimistic forecasts.
Conflating gross spread with net spread. This is the most common and most costly mistake. The price difference between two exchanges is not profit. Profit is what remains after all fees, transfer costs, and slippage are subtracted.
---
What is a crypto arbitrage calculator?
A crypto arbitrage calculator is a tool that takes the buy price on one exchange and the sell price on another, applies all relevant fees and transfer costs, and outputs the net profit or loss from executing that arbitrage trade. Advanced versions also handle funding rate arbitrage APR calculations, triangular rotation math, and real-time spread monitoring with fee-adjusted net values.
How accurate are free arbitrage calculators?
Free web calculators are often accurate for trading fees but miss withdrawal fees, slippage, and network gas. They are useful for quick estimates but should not be used for live trading decisions without manually verifying current withdrawal costs and checking order book depth for the actual trade size.
What is a good minimum net spread to target?
Most experienced traders set a minimum net spread of 0.5–1.0 % for spot arbitrage to account for unexpected slippage and market movement during the transfer window. Below 0.3 % net, the margin of error from order book changes and gas price fluctuations makes consistent execution unprofitable.
How do I calculate funding rate APR?
Funding Rate APR = Funding Rate (per 8h) × 3 × 365 × 100. For example, a 0.05 % funding rate per 8 hours = 0.05 × 3 × 365 × 100 = 54.75 % gross APR. Subtract your trading fees, borrow costs, and estimated rate decay to get the net expected APR from the rate arbitrage strategy.
What is the risk in funding rate arbitrage?
The primary risks are: the funding rate turning negative (eliminating your income), liquidation if price moves sharply against the futures leg, and exchange-specific risks like sudden fee changes, margin calls, or withdrawal halts on one side of the trade.
Can I build my own arbitrage calculator in Excel?
Yes. A basic Excel calculator needs six input cells (buy price, sell price, amount, buy fee rate, sell fee rate, withdrawal fee) and a formula row computing gross profit, total fees, net profit, and ROI %. The challenge is keeping fee data current since exchanges update their fee schedules and network withdrawal fees fluctuate with gas prices.
What fees should I include in my calculator?
Include: (1) taker fee on the buy exchange, (2) taker fee on the sell exchange, (3) network withdrawal fee for the specific asset and network, (4) estimated slippage based on order book depth, (5) gas fees if using DeFi protocols, and (6) any deposit fee charged by the destination exchange.
How does triangular arbitrage differ from cross-exchange arbitrage?
Triangular arbitrage happens within one exchange using three currency pairs, so there are no transfer fees or transfer time delays. Cross-exchange arbitrage involves moving tokens between platforms, which introduces transfer costs, transfer time risk, and the possibility that the opportunity closes before funds arrive.
How much capital do I need for arbitrage trading?
Funding rate arbitrage can be meaningful at $1,000–$5,000 because income scales linearly with position size. Spot cross-exchange arbitrage typically requires $10,000+ to generate returns that justify the operational complexity, since many fees are flat (not percentage-based) and eat a larger share of small positions.
Does ArbiScreen include fee calculations in its spread data?
Yes. ArbiScreen's spread scanner applies exchange-specific trading fees to every spread it surfaces, so the number displayed reflects net spread after fees — not the raw price gap. This allows traders to instantly see whether an opportunity is genuinely profitable without doing manual post-processing on gross data.
What is the difference between gross spread and net spread?
Gross spread is the raw price difference between two exchanges expressed as a percentage. Net spread is what remains after subtracting all fees (trading fees on both sides, withdrawal fees, and estimated slippage). An arbitrage trade is only profitable when net spread is positive after all costs are accounted for.
How do I account for slippage in my calculations?
Estimate slippage by checking the order book depth at the quantity you intend to trade. If you want to buy $20,000 of ETH and the top of the order book only has $8,000 of asks within 0.1 % of the best price, your actual average fill price will be higher. Use the weighted average fill price across your full trade size, not the best ask.
What is opportunity cost in arbitrage?
Opportunity cost is the return your capital could have earned in its next-best use during the time it is tied up in an arbitrage position. If your capital sits in a wallet waiting for a transfer for 30 minutes, it cannot earn yield elsewhere. For low-spread strategies at high frequency, opportunity cost is a real and calculable drag on net returns.
---